
AI-Native Population Health Analytics

From Population Data
to Patient Action.

The AI-native analytics platform that turns claims intelligence into closed care gaps, improved Star Ratings, and measurable ROI — at a fraction of legacy cost.

Schedule a Live Demo  → See the Platform
71quality measures 7clinical domains 5risk tiers 17CMS Star measures live in 6 weeks
01
Detect
Proven measure rules find each member's open gaps
02
Prioritize
AI ranks by closure likelihood and Star weight
03
Draft
Personalized copy per member, signed by their coach
04
Reach
Email, or a coach call from the work queue
05
Close
The next claims run closes the gap, or it returns
71
Quality measures
HEDIS MY2025/MY2026, PQA/NQF, AHRQ PQI, MNCM D5
7
Clinical domains
One engine, one denominator, every dashboard gated by role
17
CMS Star measures
13 of them triple-weighted
162
Audited actions
Written before the response returns
6 wk
To go live
No professional services fees
The 90-Second Tour

Watch HealthBenIQ end to end.

Claims in, open gaps found, members prioritized, outreach drafted and sent — the whole loop, on the real product.

1:30 · captions on screen · demonstration tenant, synthetic data.

The Challenge

The Cost of Inaction Is Measured in Billions

Legacy analytics stacks report on the past. Your members need action today.

59%

of Americans skip recommended preventive screenings

Only 8% of adults receive ALL recommended preventive services, leaving massive gaps in care quality.

Source: Aflac 2024; Health Affairs
26%

of members with care gaps drive 39% of future health spend

Unmanaged rising-risk members become high-cost claimants within 12–18 months without intervention.

Source: Springbuk
84%

of benefits consultants report point solution fatigue

Legacy analytics stacks cost $8–15 PMPM with siloed outputs and no action layer.

Source: Tendo 2024
Humana's 2024 Star Rating drop cost ~$3B in lost bonus payments and erased $4B in market cap in a single day. Can your organization afford to wait?
The Platform

Where spend is going.
Which gaps are closing.
What to act on next.

One command center, zero data silos. Purpose-built analytics for every stakeholder — from the CMO to the care manager to the benefits advisor — all drawing from a single source of truth, and each one gated by role.
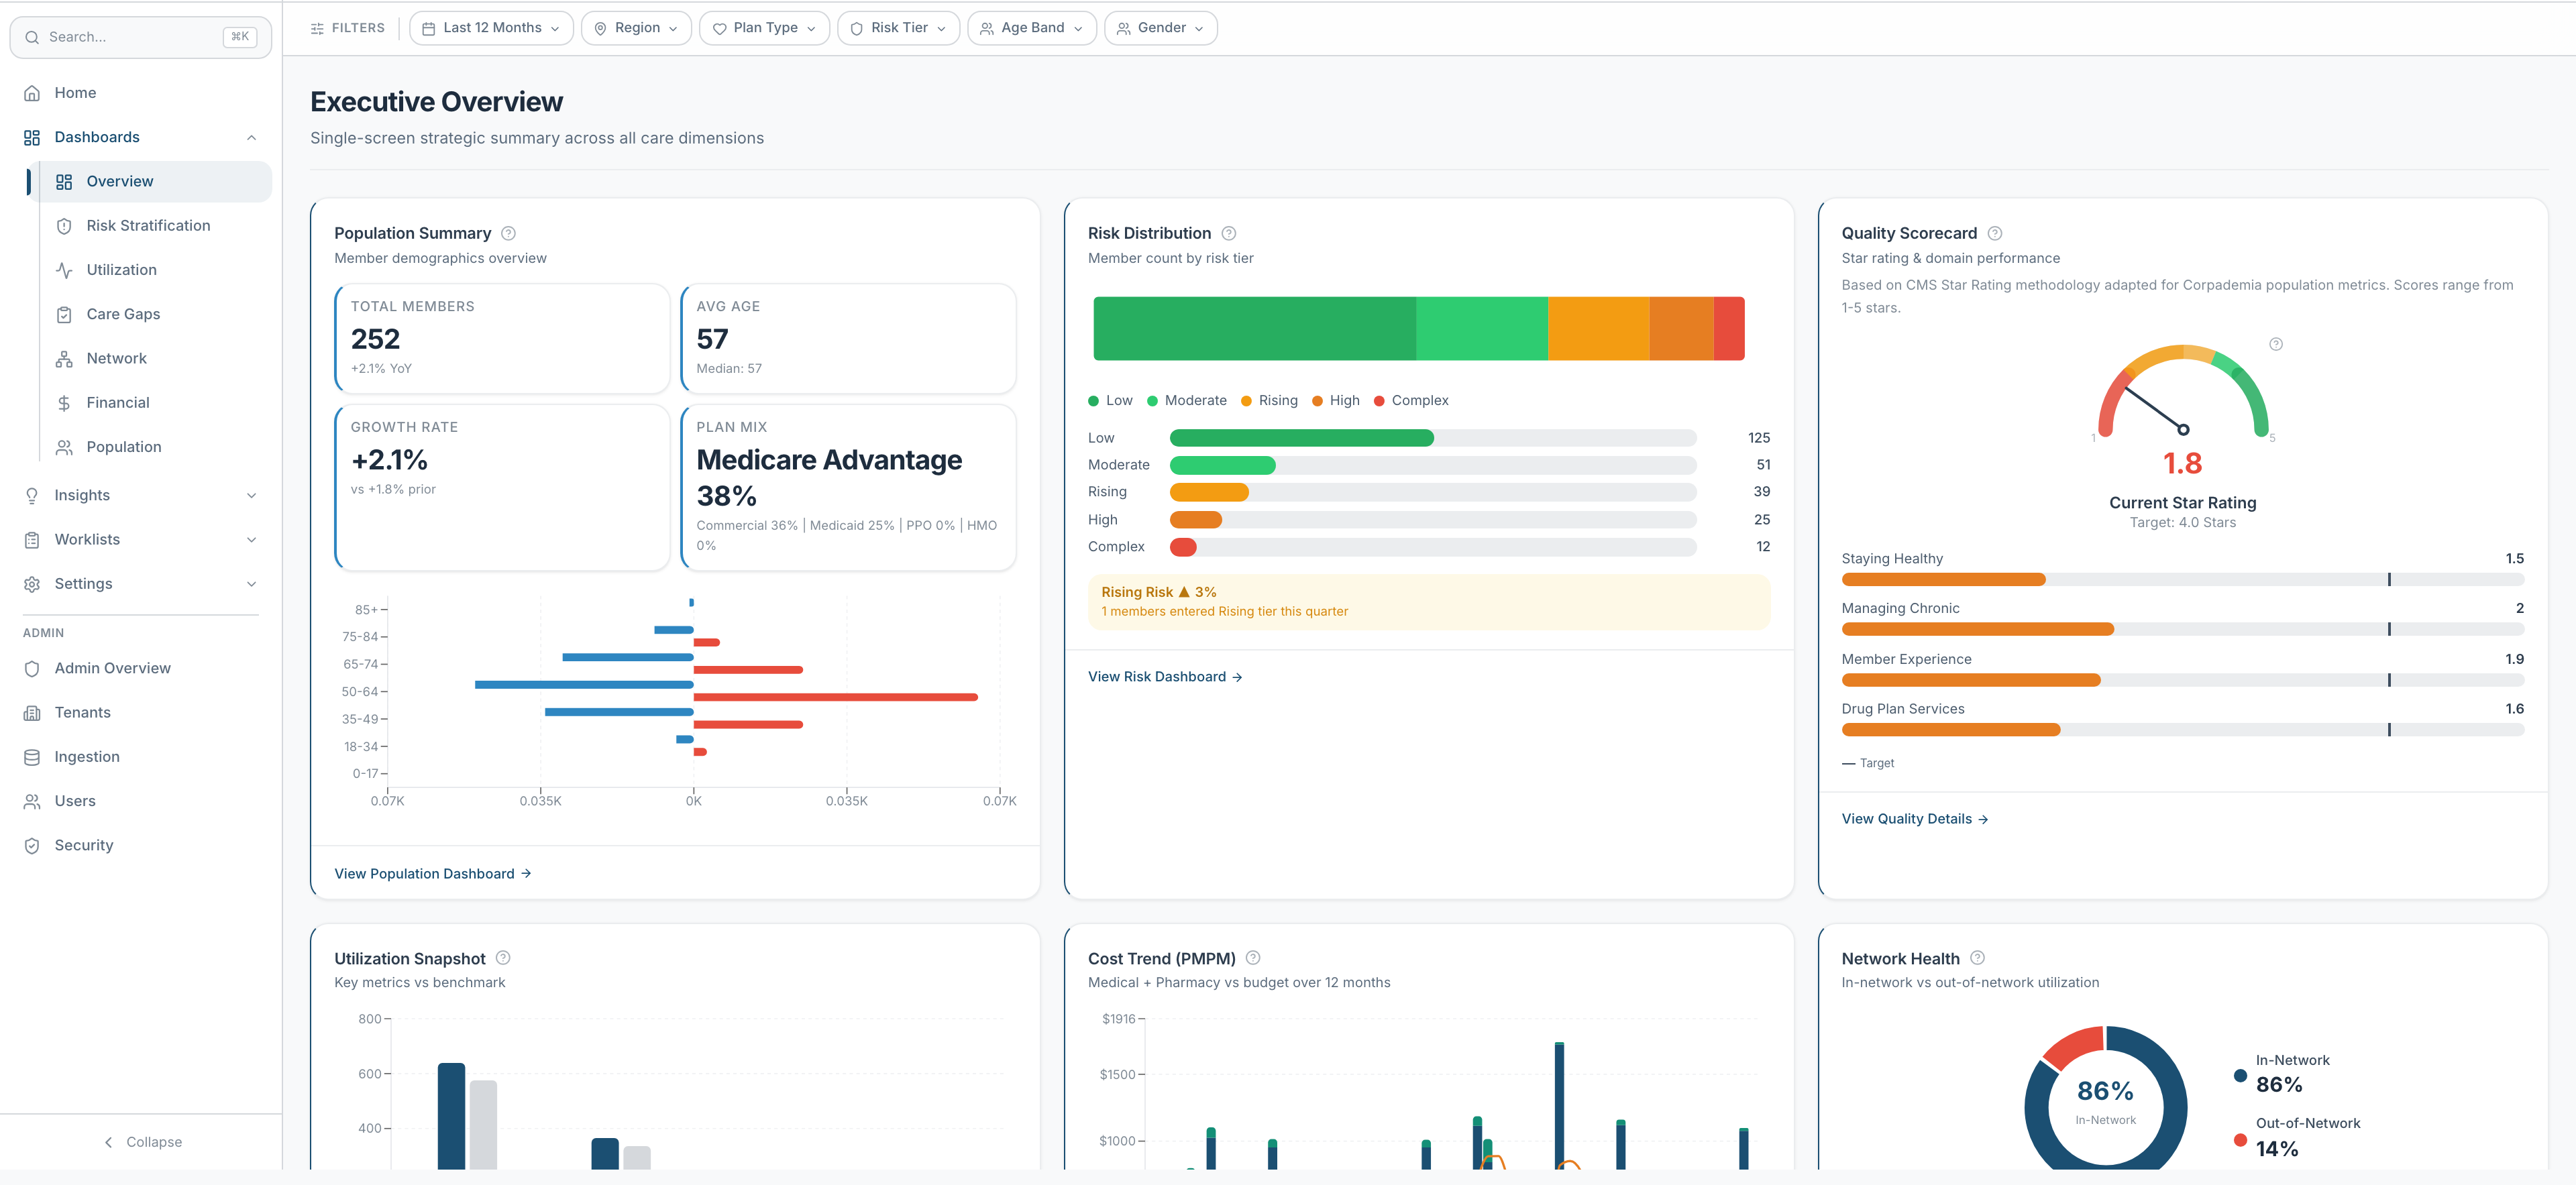
  • KPI command center with AI-generated narrative insights
  • 5-tier risk model with rising-risk intervention triggers
  • Star Rating projection across 17 Star measures
  • Branded PDF, Excel and PowerPoint exports
HealthBenIQ Executive Overview — population summary, risk distribution and quality scorecard on one screen
Executive Overview — demonstration tenant, synthetic data.
Core IP

71 Quality Measures. Zero Guesswork.

Our care gap detection engine implements 71 quality measures across 7 clinical domains — aligned to HEDIS MY2025/MY2026 and extended with PQA/NQF Part D Star adherence, AHRQ prevention quality indicators, the MNCM D5 composite and our own optimal-medical-therapy protocol rules. No AI guesswork decides what counts as a gap: every result follows the published measure rules, gives the same answer every time, and can be checked against the specification.

Medication
19
Preventive
12
Overuse
11
Chronic
10
Utilization
10
Behavioral
8
Care Coordination
1
71 measures · 7 clinical domains NCQA HEDIS, PQA/NQF Part D Star, AHRQ PQI, MNCM D5, OMT
A measure whose source data is absent is designated No Benefit and never run — so an empty pharmacy feed can't manufacture thousands of phantom gaps against members who could never have passed.
Executive Overview
AI-generated narrative insights across all domains
CMO · VP Quality
Risk Stratification
Rising-risk intervention triggers and cost predictions
Care Management
Utilization Management
ED, inpatient and readmission trends, network leakage
Utilization Review
Care Gaps & Quality
Closure recommendations and Star Rating projection
Quality · HEDIS Teams
Network Performance
Provider scorecards, referral patterns, panel capacity
Network Management
Financial Analytics
PMPM trends, medical loss ratio, cost-of-care cohorts
CFO · Actuarial
Population Health
Segmentation, enrollment trends, chronic disease burden
Population Health
Optimal Medical Therapy
Cardiometabolic therapy attainment, not diabetes alone
Medical Director
Employer Analytics
Cross-employer cost, risk and quality comparison
Employer · Coalition
Broker Analytics
Billed-vs-paid, renewal schedules, plan-design comparison
Benefits Advisor
Who It's For

One Platform, Every Seat at the Table

Health Plans

Star Ratings you can move

Star Rating projection across 17 CMS measures, 13 of them triple-weighted, with what-if modeling and a 5-tier risk model that flags rising risk while the intervention window is open.

TPAs

Many clients, one tenant model

An organization can hold many client tenants with its own admins, billing and cross-tenant work queues. Tenant data never crosses the boundary.

Brokers & Advisors

Your book, under your brand

Book-of-business view with billed-vs-paid, renewal schedules and plan-design comparison — and the whole platform can carry your logo, colors and login screen.

Self-Funded Employers

Hold every vendor to its number

A scorecard per point solution computed from your own claims — clinical, financial, engagement and operational — benchmarked against population norms.

ROI

Measurable Return. Provable Value.

Three worked scenarios showing how the platform pays for itself.

$2.4M

Star Rating Improvement

Close 500 care gaps to unlock a +0.25 Star improvement. 4+ Stars earns a 5% benchmark bonus, around $600 per member per year in additional revenue.

$840K

Rising Risk Intervention

Intervene on 200 rising-risk members before escalation, at an assumed $4,200 average cost avoided per member.

$1.2M

Outreach Gap Closure

Outreach to 1,000 members with open care gaps at an assumed 15% closure rate by email and coach calling, plus downstream cost avoidance.

$4.4M
Modeled year 1 value
At 100,000 members
500
Care gaps closed
In the model
+0.25
Star improvement
Assumed
6 wk
To go live
Versus 6–12 months for a legacy stack

These are illustrative models built on published benchmarks and stated assumptions — not results from a named client, and not a projection of your population until we have run your data.

Enterprise Security

Healthcare-Grade Data Protection

Built into every layer — not bolted on after the fact.

Dataset-per-tenant isolationEach client's PHI resides in its own warehouse dataset — no shared tables, no cross-tenant query paths.
15 granular rolesFrom super_admin to care_navigator — 7 carry PHI access and 8 do not, each precisely scoped.
Multi-factor everywhereRequired for every user in production, with step-up re-authentication on sensitive actions.
162 audited actionsWritten before the response returns, into each tenant's own audit table.
Get Started Today

Ready to Close the Gap?

See your data in the platform — not a canned demo. We'll load a sample of your claims and show real insights in 30 minutes.

  • Live in 6 weeks — no professional services fees, no consultants
  • Simple per-member-per-month pricing, directly or through your advisor
  • BAA and DPA signed per client before any PHI moves